SageMaker Adds Deep Observability for AI Inference
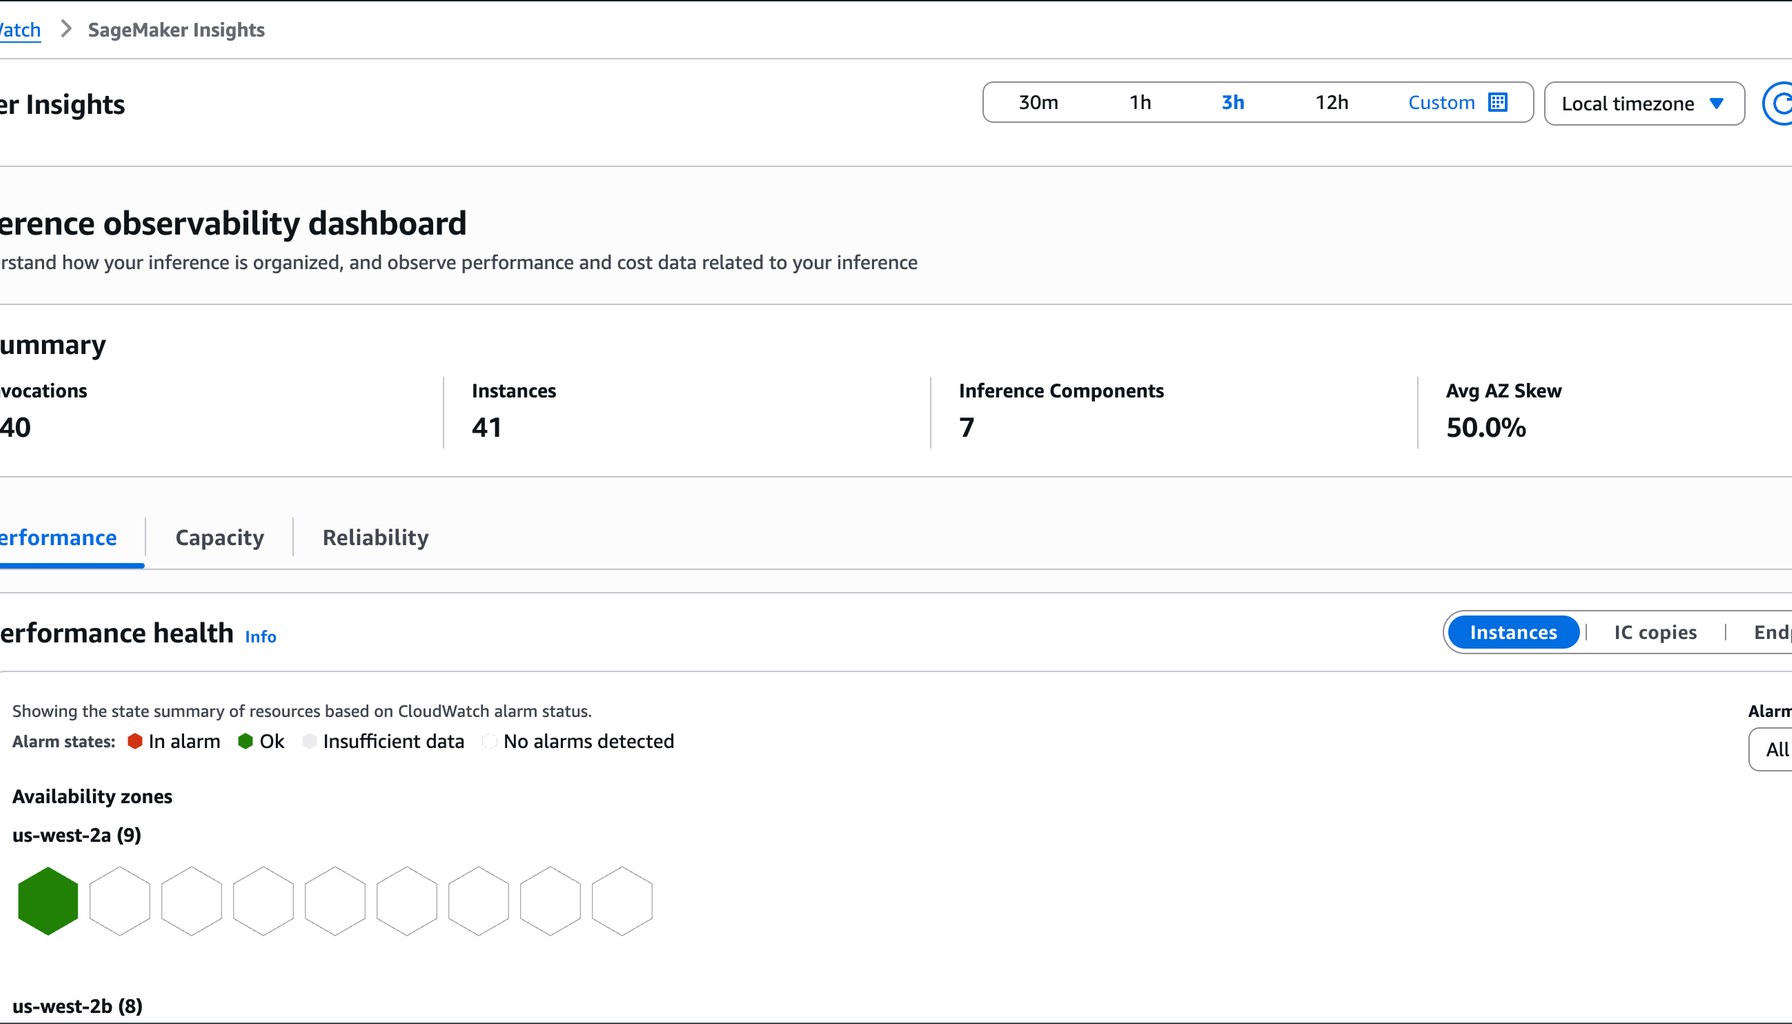
Image / AWS Machine Learning
Latency spikes on a live LLM endpoint can crater user experience in minutes. That blunt truth is at the center of Amazon’s latest push to bring production-grade observability to generative AI workloads, enabling teams to diagnose root causes in minutes rather than hours.
SageMaker AI now pairs fully managed real-time inference hosting with a detailed metrics and Insights dashboard in CloudWatch. The goal is to help ML platform engineers, MLOps teams, and site reliability engineers keep dozens of models and hundreds of GPU instances healthy, responsive, and cost-efficient as the shift from training to serving accelerates. The blog post explains that inference endpoints emit metrics and that a centralized dashboard can surface signals across the lifecycle of a production workload, from latency to resource utilization.
There are two endpoint architectures that are especially relevant for generative AI. Single-model endpoints (SME) host one model per dedicated fleet, which makes them simple to reason about but less space-efficient at scale. Inference component endpoints (IC), by contrast, let multiple models share a common pool of GPUs, with each model defined by its own resource needs and scaling policy. The team reports that IC endpoints are the recommended architecture for production generative AI workloads because they support multi-model hosting on shared GPU infrastructure, independent scaling per model, and high availability through copy distribution across availability zones.
The practical value of this observability work is measured in the moments after a spike when operators must decide among competing explanations. The blog highlights the common culprits: GPU memory pressure, a saturated KV cache, unbalanced traffic across Availability Zones, or an autoscaling policy that failed to trigger. The emphasis is on narrowing the blast radius quickly, rather than trying to knead a convoluted graph for answers. The team reports that dissecting those signals in CloudWatch becomes feasible with the new dashboards, especially when production fleets span dozens of models and hundreds of GPU instances.
For practitioners, the shift to IC endpoints plus enhanced observability maps to four concrete takeaways. First, architecture choice matters at scale. IC endpoints unlock multi-model hosting and independent per-model scaling, but they also introduce shared infrastructure that requires careful capacity planning and clear per-model quotas to avoid cross-model contention. Second, observability is a product feature, not an afterthought. The detailed metrics and Insights dashboard are designed to surface bottlenecks in real time, helping teams distinguish whether a spike is downstream of the model, the hosting hardware, or the network path. Third, operational discipline is essential. Teams must tune scaling policies and AZ distributions to balance cost against reliability, recognizing that a late autoscale trigger can cascade into degraded latency for users. Fourth, cost and resilience go hand in hand. Shared GPUs reduce idle capacity, but underserved or overlapped workloads can still thrash if per-model requirements aren’t encoded into resource requests and limits.
In a world where the difference between a good experience and a failed one can hinge on a few milliseconds, the new SageMaker observability stack provides a practical, engineering-focused path to stability. By formalizing how teams observe, diagnose, and respond to latency events, the blog post portrays a clear picture of how production ML teams can operate at scale without sacrificing performance or blowing budgets.
- Monitor and debug generative AI inference with SageMaker detailed metrics and Insights dashboard on CloudWatchAWS Machine Learning / Primary / Published JUN 18, 2026 / Accessed JUN 21, 2026